
Are you familiar with the Skyscraper Index?
There are some rather tall buildings in and around southern California, specifically San Diego, but we don’t have the skyscrapers that a lot of other cities have.
We think there’s something interesting about what the Skyscraper Index can tell us, however, and we want to share what we know with you today.
What is the Skyscraper Index?

The Skyscraper Index is a whimsical concept that was proposed by Andrew Lawrence, a property analyst at Dresdner Kleinwort Wasserstein, an investment banking company. This was devised in January 1999, and it shows that the world’s tallest buildings were created and constructed on the eve of economic downturns.
Do economic cycles and skyscraper construction actually have a relationship? What can this tell us about what to expect with coming recessions and periods of great economic successes?
According to the Skyscraper Index, there’s a large investment in skyscrapers when cyclical growth has started spiraling downwards and the economy is poised to move towards recession.
That might make it seem like an increase in skyscrapers is a harbinger of doom.
But, is it accurate?
Let’s Look at the Financial Crises in the 2000s
Mark Thornton’s Skyscraper Index Model was pretty accurate in the late 2000s. It indicated that the financial crisis would be coming, and it proved to be correct. In early August of 2007, there was a huge increase in skyscraper construction. Those buildings might have been completed after the onset of the recession, and that demonstrated that timing had an impact. Another business cycle can come in and help the economy bounce back. Or, a looming recession could be canceled altogether.
Still, when the buildings start to go up, there may be an unease in what that means for the economy.
The reasoning had been that height foretold economic boom. But, maybe not. The Lawrence Skyscraper Index shows that those projects actually predicted economic crisis, not strength.
Skyscrapers or GDP?
 The Skyscraper Index is not uniformly agreed upon as an accurate economic model.
There are others.
In fact, one statistical study found that the height of buildings is not an accurate predictor of recessions or other aspects of the business cycle. Instead, the model shows that gross domestic product (GDP) can predict the height of building construction. That might be a correlation that makes more sense.
Critics find this unreliable. However, there are some interesting merits.
Most interesting, is that it started as a joke.
What’s So Funny about Skyscrapers?
The name of the research paper was funny on its own: “The Skyscraper Index: Faulty Towers.” This was a joke that referenced a popular comedy. Lawrence was comparing historical data, mostly from the U.S. He didn’t bother looking at overall construction statistics and his model did not take into consideration any investment numbers or data. Instead, he looked one hundred percent at those record-breaking skyscraper projects.
- Panic of 1907
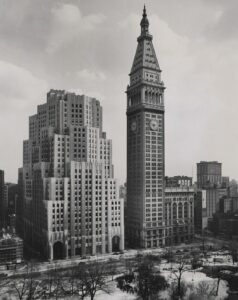 Our first example in Lawrence’s research is the Panic of 1907. Two record-breaking skyscrapers, the Singer Building and the Metropolitan Life Insurance Company Tower, went up in New York right before the stock market panic. The skyscrapers were completed in 1908 and 1909. Until 1913, the Met Life building was the tallest in the world.
- Wall Street Crash of 1929
 This was a big one, everyone can easily agree. The Wall Street Crash of 1929 set off a major depression. And, you may or may not be surprised to know, there was a string of skyscrapers constructed right before this happened. Those buildings include 40 Wall Street, The Chrysler building, and The Empire State Building.
Some pretty heavy hitters.
- Oil Crisis and Stock Market Crash (1973)
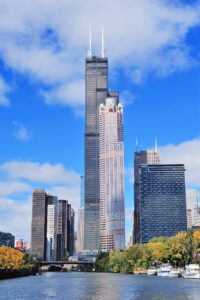 Some other big and towering buildings to consider are The World Trade Center Towers and The Sears Tower. These opened in 1973. This coincided with the 1973/1974 stock market crash and the oil crisis that took hold in 1973 and caused major inflation and crippling economic downturns.
- Don’t Forget 1997
 In 1997, we saw The PETRONAS Twin Towers open. That’s also when the Asian Financial Crisis began, and it didn’t let up for five long years. There were global ramifications, leading to speculation, over-investment, and monetary expansion.
- Building in 2005
 Fast forward to 2005, when five media corporations all decided to invest in new Manhattan skyscrapers. The New York Times Building was one of them and the tallest. None of these were record breakers, but it’s worth noting that things began going from bad to worse in the years following 2005, particularly in the mortgage and real estate industries.
There’s another framework that follows a similar theory: The Austrian Business Cycle Theory. This follows some old economic principles made famous by Richard Cantillon in the eighteenth century. His research comes close to supporting the Skyscraper Index, by putting forth these ideas:
- A decline in interest rates allows for a brief building boom, which increases land prices.
- The decline in interest rates will allow for expansion within a company or the size of a firm. This drives a demand for larger office spaces and thus, taller buildings.
- Interest rates that are lower will provide incentive to construction companies. They’ll have the technology and the tools to break earlier records, constructing unexpected marvels that may not have been possible previously.
All of this, of course, will peak, leading to the end of economic growth and the potential for a downturn.

We will let you decide whether there’s any merit to the Skyscraper Index. We love talking about theory as much as we love talking about real estate and property management. Do let us know what you think, and where you think our economic trends may currently be shifting.
If you’d prefer to talk about how we can help you lease, manage, and maintain your investment properties, we’re here for that as well. Please contact us at Cal-Prop Management. We work with investors in San Diego and the surrounding areas, including La Mesa, El Cajon, Encinitas, San Marcos, and Rancho Bernardo.
